Build faster. Monitor automatically. Act smarter.

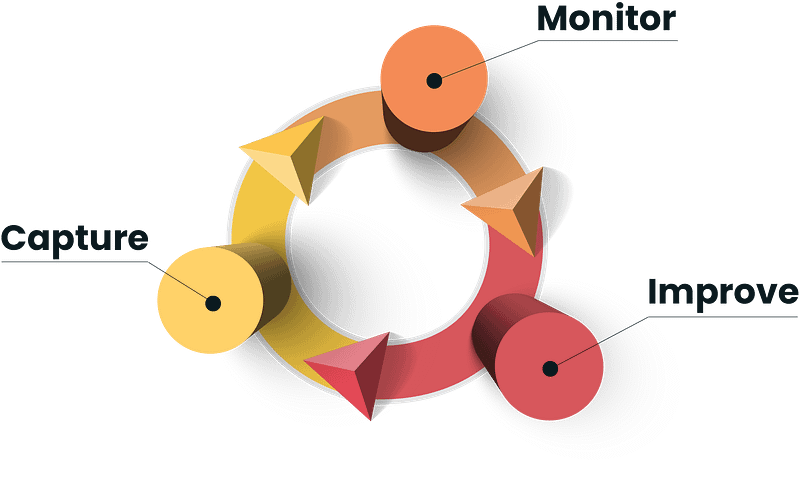
Houston guides your teams through a complete improvement loop, from capturing operational data to monitoring performance to driving measurable improvement. Here’s exactly how it works.

Three stages. One continuous cycle.

Houston isn’t just a digitization tool. It’s a complete system for continuous operations improvement that works across three connected stages

Capture: digitize workflows and operational data

Turn paper forms, spreadsheets, and manual processes into structured digital workflows – in hours, not weeks.

AI-Powered No-Code Builder

Describe your process in plain language, and Houston generates the complete app – forms, data model, workflows, and dashboards.


Example:

  • You say: “I need to track quality incidents with photos, root cause analysis, and corrective actions”
  • Houston creates: Complete incident management app with all forms, fields, relationships, and workflows

Timeline: Seconds to generate, hours to refine and launch

Pre-built templates

Or start with proven templates for common operational processes:

  • Quality non-conformities
  • EHS incidents & safety audits
  • Maintenance requests & work orders
  • Customer complaints & feedback
  • Production tracking & line performance
  • Risk registers & assessments
  • Training management
  • Improvement opportunities

Each template is fully customizable to your specific needs.

Customize Without Code

Adapt any app to your workflows:

  • Add or remove fields
  • Change workflows and statuses
  • Create custom views and filters
  • Design forms for mobile or desktop
  • Set validation rules and logic
  • Configure permissions and access

No technical skills required.

If you can use Excel, you can build in Houston.

Real world example

Day 1
Morning
Creation

Quality manager describes Non-Conformity process to Houston AI.

Day 1
Afternoon
Fine-tuning

Complete app generated, team reviews and adjusts fields/workflows.

Day 2
Launch

App launched. Team starts logging Non-Conformities on mobile devices from the production floor.

Week 2
Adoption

20+ Non-Conformities captured, patterns emerging, dashboards showing real-time safety metrics.

What Houston captures

Relationships & Context

  • Link incidents to specific equipment
  • Connect actions to root causes, KPIs, processes…
  • Track recurrence patterns across time
  • Build operational knowledge graph

Structured Data

  • Who, what, when, where details
  • Photos, documents, attachments
  • Equipment, materials, processes involved
  • Severity, priority, categories
  • Assigned responsibilities

Operational Events

  •  Incidents, non-conformities, deviations
  • Audits, inspections, observations
  • Maintenance requests, equipment failures
  • Customer complaints and feedback
  • Improvement ideas and opportunities

Monitor: Track performance and detect deviations automatically

Houston doesn’t just store data. It actively watches your operations 24/7, alerting you the moment something needs attention.

KPI Engine

Define performance indicators linked directly to your operational data:

Common KPIs:

  • Incident rate, response time, time-to-resolution
  • Quality metrics: defect rate, rework percentage, customer complaints
  • Equipment performance: availability, MTTR, MTBF
  • Safety metrics: near-miss frequency, days without incident
  • Process efficiency: cycle time, throughput, waste
  • Any custom metric relevant to your operations

Setup is simple: Select data source, define calculation, set targets and thresholds. Houston tracks everything automatically.

Automatic Deviation Detection

Houston monitors every KPI continuously and detects when performance drifts.

Three detection modes:


1 – Threshold Alerts
Triggered when KPI exceeds (or falls below) defined target.

Example: “Quality incident rate this week: 8 (target: 5)”


2 – Trend Alerts
Triggered when performance is declining over time.
Example: “Machine availability declining 3 weeks in a row”


3 – Anomaly Detection
Triggered when pattern breaks from historical normal.
Example: “Unusual spike in customer complaints this month”

Smart Notifications

Notify the right people at the right time.

Alerts are routed to the right people based on:

  • Role and responsibility (who owns this KPI?)
  • Severity and urgency (critical vs warning)
  • Escalation rules (notify manager if not resolved in X hours)
  • Site or team assignment (only relevant stakeholders)


Notification channels:

  • In-app notifications
  • Email alerts
  • (soon) Integration with Slack, Teams, etc.

Real Time Dashboards

Track performance live with fully customizable dashboards for:

Daily Team Meetings 

  • Today’s incidents, actions, and priorities
  • KPIs: green/yellow/red status
  • Quick drill-down to details


Weekly Performance Reviews 

  • Week-over-week trends
  • Top issues and root causes
  • Action completion rates
  • Performance vs targets


Executive Views

  • Site or network-wide performance
  • Strategic KPIs and objectives
  • Improvement initiatives progress
  • Benchmarking across sites


Role-Specific Views

  • Quality manager dashboard
  • EHS coordinator dashboard
  • Maintenance supervisor dashboard
  • Plant director dashboard

Real world example

Monday
8:00 AM
Incident

Quality incident logged on Line 3 (product defect)

Monday
8:05 AM
Detection

Houston updates KPI automatically:

  • Incidents this week: 5 (target: 4) ⚠️
  • Threshold alert triggered
Monday
8:06 AM
Notification

Notification sent to Line Manager + Quality Manager:

  • "Line 3 quality incidents above target - immediate attention needed"
Monday
8:30 AM
Action

Team daily standup dashboard shows:

  • Line 3 flagged red
  • Drill-down shows: 3 of 5 incidents same defect type
  • Team investigates immediately
Result

Problem detected and acted upon same day, not discovered weeks later in monthly review.

Improve: Act on problems and measure what works

Houston helps you move from detection to action, track what you do, and measure whether it worked.

From Problems to Actions

When you capture an incident, audit finding, or improvement opportunity, create an action plan directly in Houston

Action Creation:

  • Create actions from any captured event
  • Or create standalone improvement actions
  • Link action to the problem it addresses
  • Define clear description and expected outcome


Assignment & Tracking:

  • Assign owner and deadline
  • Set priority level
  • Add milestones if needed
  • Track progress with status updates


Evidence & Completion:

  • Document progress with comments and updates
  • Attach photos or documents as proof
  • Mark complete when done
  • Add notes on results and lessons learned

Measure the Impact

Close the loop by watching your KPIs before and after taking action:

Track Results:

  • Monitor KPIs linked to the problem area
  • Compare performance before/after action
  • See if the problem recurs or stays resolved
  • Measure time-to-resolution


Dashboard Visibility:

  • Open actions dashboard shows what’s in progress
  • Overdue actions automatically flagged
  • Completed actions with their outcomes
  • KPI trends show whether improvements stick

Build Knowledge Over Time

Every action you take becomes searchable organizational memory:

What Gets Captured:

  • Problem description and context
  • What action was taken
  • Who did it and when
  • Whether it worked (KPI impact)
  • Lessons learned and notes


Why This Matters:

  • Search past incidents when similar problems occur
  • Review what worked before trying something new
  • Share solutions across teams and sites
  • New team members can learn from history
  • Don’t solve the same problem twice

Real world example

Monday
Detection
  • KPI alert: Quality incidents rising on Line 3
  • Manager reviews recent incidents, sees pattern
Tuesday
Action Created
  • Action: "Recalibrate equipment + update PM schedule"
  • Owner: Maintenance supervisor
  • Deadline: Friday
  • Linked to KPI: "Quality incident rate"
Wednesday-Friday
Execute
  • Maintenance completes calibration
  • Documents with photos in Houston
  • Marks action complete
Week 2
Measure Impact
  •  Quality incident rate returns to normal
  • KPI dashboard shows improvement
  • No recurrence over next 2 weeks
Week 4
Knowledge Reuse
  • Similar issue appears on Line 7
  • Manager searches past Line 3 incidents
  • Finds documented solution and reapplies
  • Problem solved in 1 day instead of 4
Result

Systematic action tracking + KPI measurement = faster problem-solving and reusable knowledge

Experience improvement without friction

Choose how you want to get started with Houston.

Start with Houston Foundations

Get immediate access to pre-built apps for issues and actions management, ready-to-use dashboards, and core automation features.

What’s included:

  • Issues & Actions apps
  • Team dashboards
  • Basic automations
  • Unlimited users
  • Email support


Perfect for: Operations teams ready to digitize their first process and start improving immediately.

Free for 12 months, no credit card required

Book a Personalized Demo

We’ll walk through how Houston would work for your specific workflows, scale, and improvement objectives.

What we’ll cover:

  • Building an app in real-time (your process)
  • KPI monitoring and automated alerts
  • Improvement workflows and root cause analysis
  • Governance setup for your organization


Perfect for: Enterprise teams evaluating platforms, multi-site operations, or anyone wanting to see Houston before committing.

See Houston in action, tailored to your operations.

Start with Houston Foundations Now

Subscribe to our newsletter

Sign up to receive updates, promotions, and sneak peaks of upcoming products. Plus 20% off your next order.

Promotion nulla vitae elit libero a pharetra augue